Model UV-Vis
This tutorial will demonstrate how to predict UV-vis spectra using density functional theory. All of the calculations and analysis can be performed on your laptop using a simple graphical interface.
This tutorial requires local installation of ORCA and ChimeraX (plus the SEQCROW extension to ChimeraX). Instructions for setup can be found here. All of the input, output, and analysis files for the calculations in this tutorial can be found here. The files are provided so that so that you can play around with visualization and analysis before running your own calculations.
Table of contents
- “The Most Indiscriminate Reagent”
- Diazo Series
- Write Inputs
- Analyze Output
- Plot Spectrum
- Experiment vs DFT
- Interpreting Absorption
- Reactivity
“The Most Indiscriminate Reagent”
In 1956, William von E. Doering and co-workers photolyzed diazomethane to generate methylene, which inserted into the C-H bonds of various alkanes with statistical selectivity (JACS 1956, 3224). This reactivity earned methylene the title of “the most indiscriminate reagent known in organic chemistry.” More recently, Huw Davies and co-workers demonstrated that carbenes derived from alpha-diazoacetates can be generated under mild conditions (blue LEDs), and intercepted for synthetic applications Chem. Sci. 2018 5112-5118. Notably, much higher yields were obtained from diazo compounds that absorbed at longer wavelengths (further into the visible region). This led me to wonder whether DFT would serve as a useful model to quickly check whether a given diazo compound absorbs visible light.
Diazo Series
I chose a paper that reports the UV-vis features of seven reasonably diverse diazo compounds and sought to assess whether DFT could recapitulate the experimental trends (Justus Liebigs Ann. Chem. 1959, 34–43). The figure below illustrates the relevant compounds and their lowest energy electronic transitions.
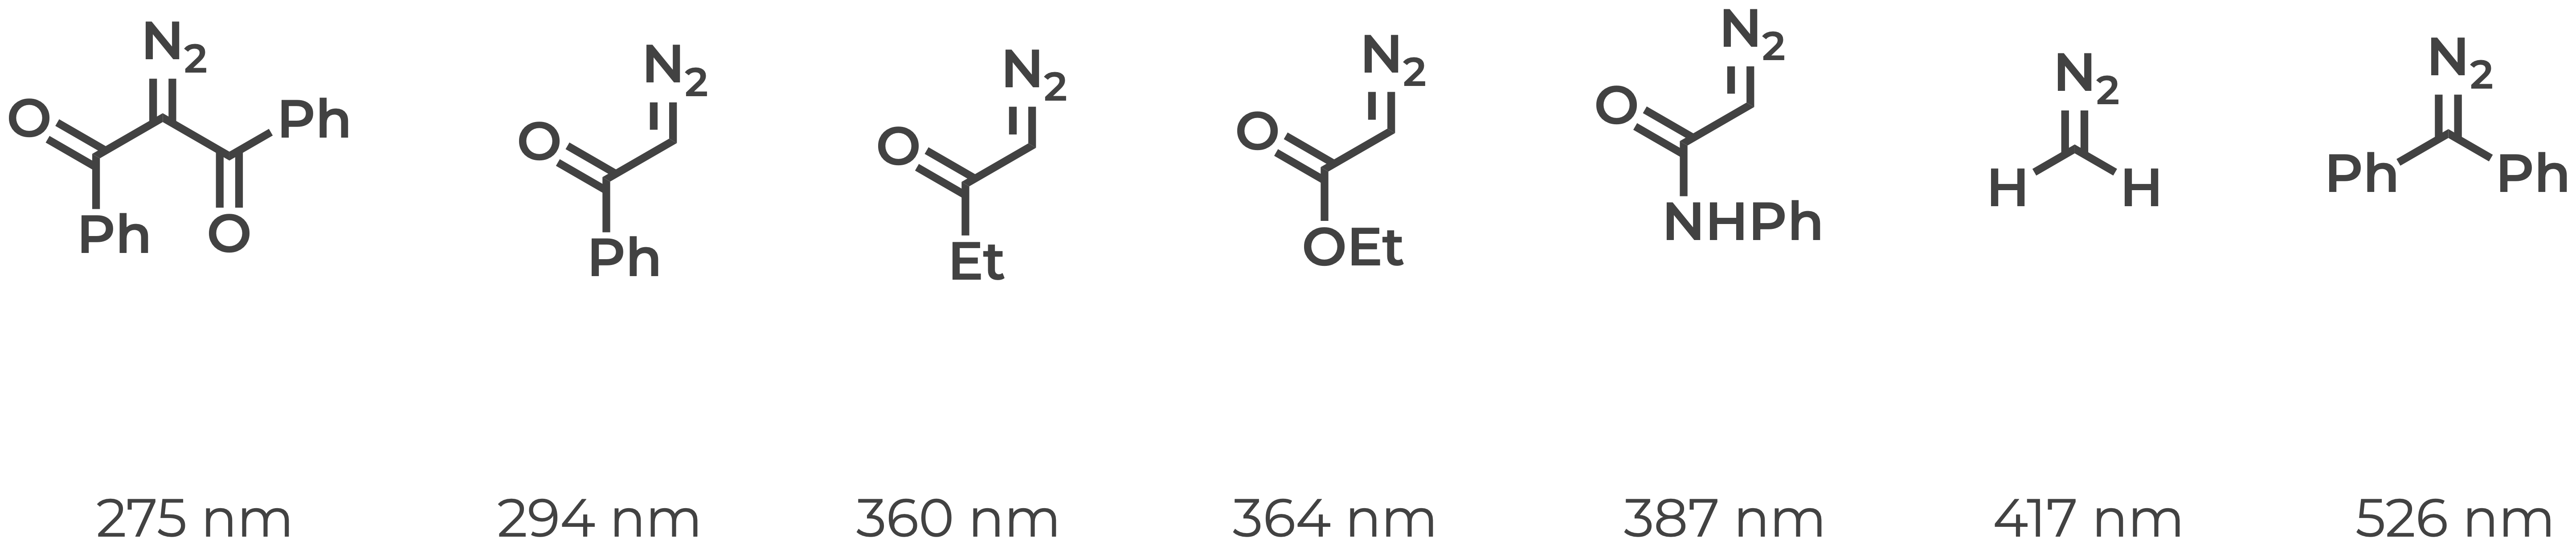
I found this series puzzling. We teach in introductory organic chemistry that increasing conjugation tends to shift the absorption spectrum to longer wavelengths. In this series, however, we observe the unusal trend that the least conjugated compound has the second longest wavelength (diazomethane, 417 nm) and the most conjugated compound has the shortest wavelength (2-diazo-propane-1,3-dione, 275 nm).
Write Inputs
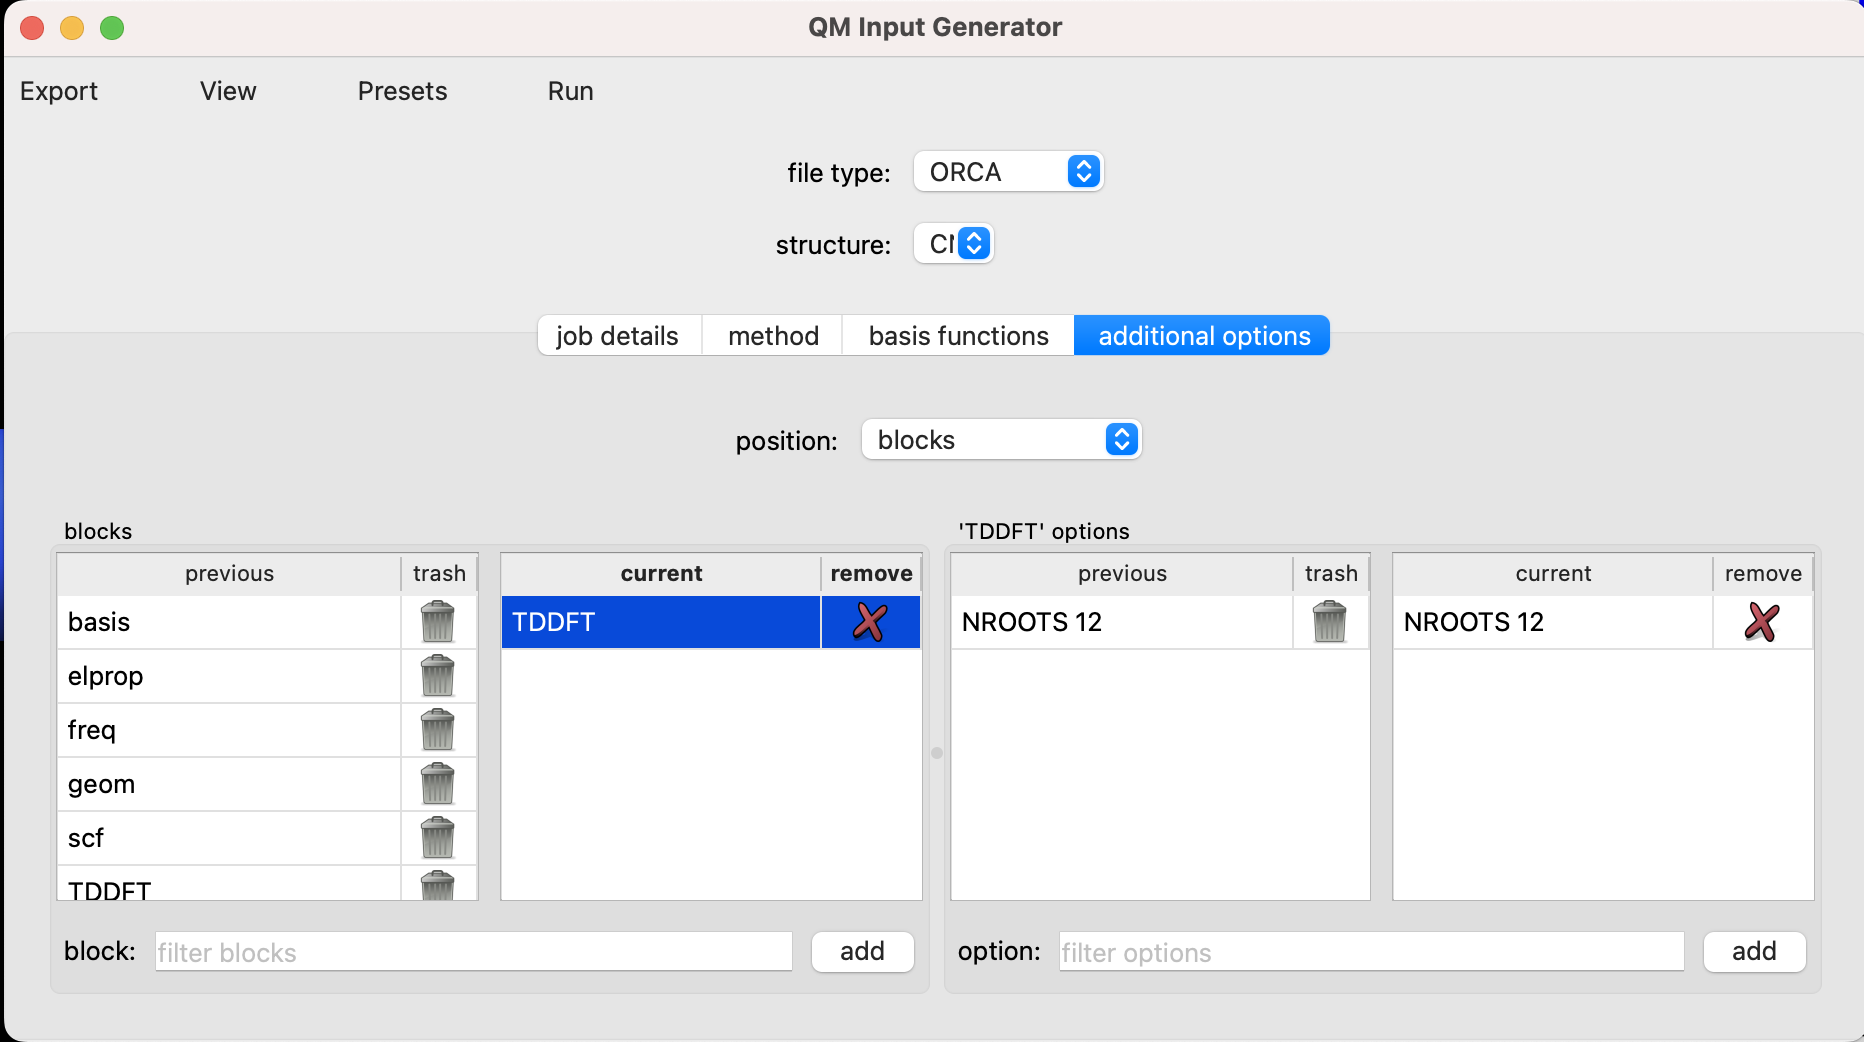
The structures of all the compounds in the diazo series were optimized using a procedure similar to the one described previously. Rather than computing these geometries yourself, you can download the output files from my calculations in the zipped directory linked here. Open the outputs in ChimeraX and use the geometries from my outputs as your inputs. The electronic transitions then can be calculated by adding a %TDDFT (time-dependent density functional theory) block to the input file along with the appropriate number of roots. We only need one root to model the lowest energy electronic transition, but we use 12 roots so that we can also model the full UV-vis spectrum later on. The %TDDFT block can be added in ChimeraX + SEQCROW QM input generator as illustrated in the screenshot below.
The input file for diazomethane is provided below. You can preview your input file in Chimerax + SEQCROW within the QM input generator from the dropdown menu “View > Preview”. Note that printBasis in the header and the block %scf print[p_mos] 1 end are included so that we can visualize orbitals later.
! B3LYP TightSCF printBasis def2-TZVP
%pal
    nprocs 1
end
%scf
    print[p_mos] 1
end
%TDDFT
    NROOTS 12
end

*xyz 0 1
H     1.726633  -0.944897  -0.001218
C     1.203408  -0.000000  -0.000981
H     1.726633   0.944897  -0.001218
N    -0.079228  -0.000000  -0.000264
N    -1.229147   0.000000   0.000382
*
Analyze Output
After running these calculations, you can inspect the output file, where you will find that the first electronic transition of diazomethane absorbs at ~419 nm. An excerpt of the output file is provided below.
-----------------------------------------------------------------------------
         ABSORPTION SPECTRUM VIA TRANSITION ELECTRIC DIPOLE MOMENTS
-----------------------------------------------------------------------------
State   Energy    Wavelength  fosc         T2        TX        TY        TZ
        (cm-1)      (nm)                 (au**2)    (au)      (au)      (au)
-----------------------------------------------------------------------------
   1   23890.9    418.6   0.000000000   0.00000   0.00000  -0.00001  -0.00000
Plot Spectrum
The procedure to model the UV-vis spectrum of a compound is similar to the process described for IR spectra. To begin, download the zipped directory linked here. Open the files titled Ph2CN2H-tddft.out and PhCOCN2COPh-tddft.out with ChimeraX. Navigate to Tools > Quantum Chemistry > UV/Vis Spectrum.
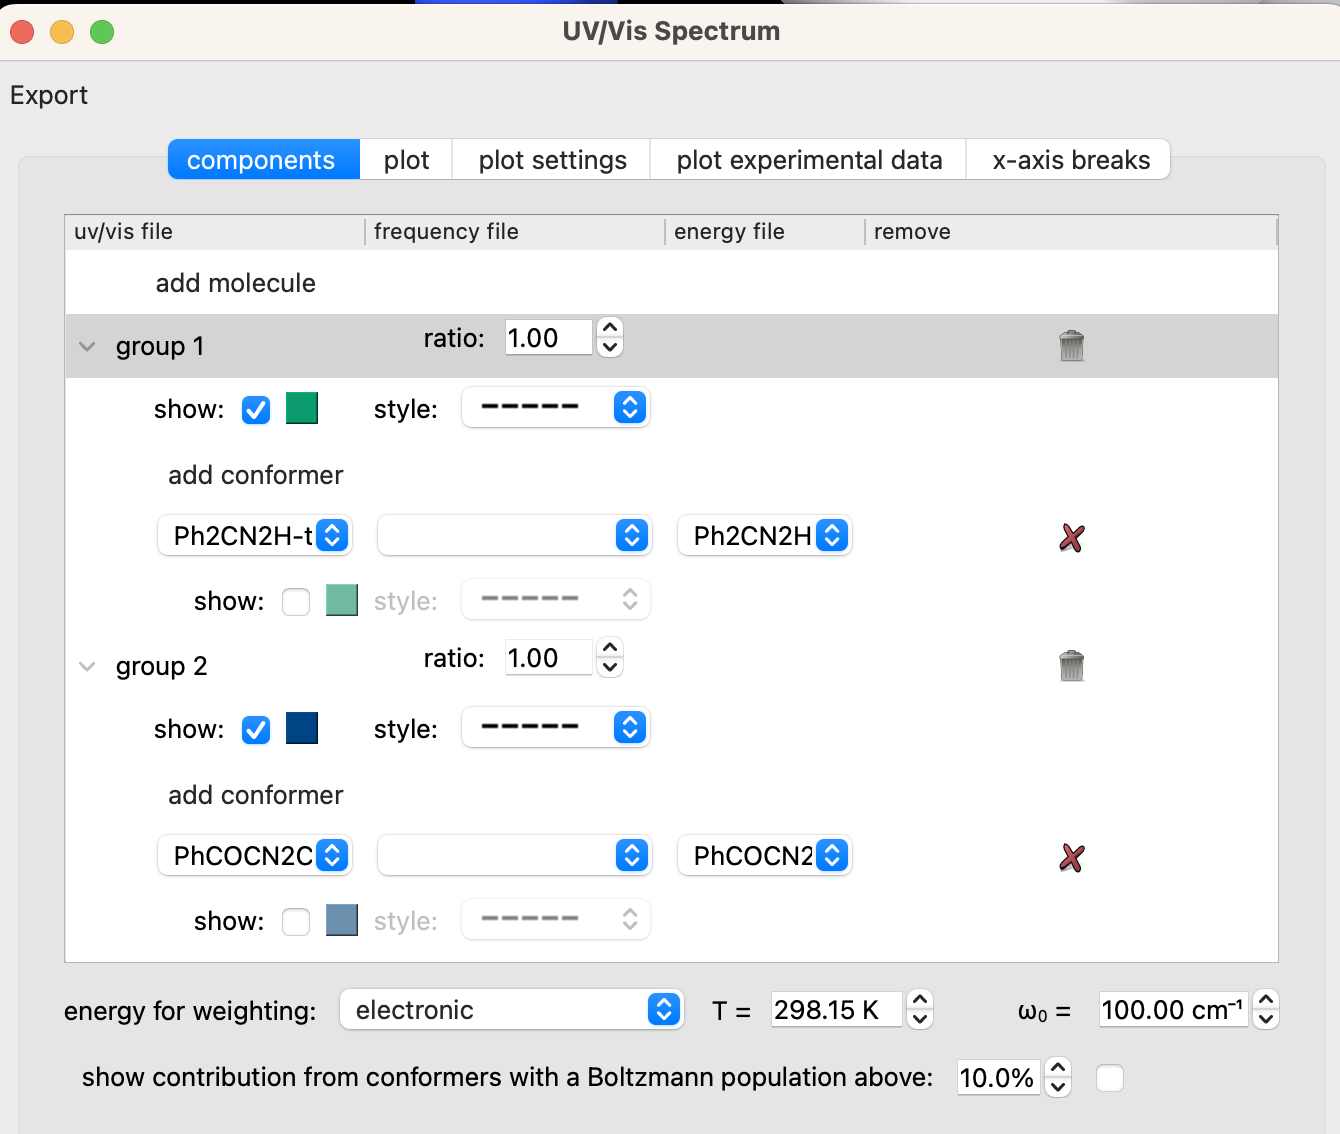
Set the options in the “UV/Vis Spectrum” window under the “components tab” to match those in the screenshot below. You may also need to go to the “plot settings” tab and set “peak type” to “Gaussian”, “FWHM” to “0.5 eV”, and “x-axis units” to “nm”.
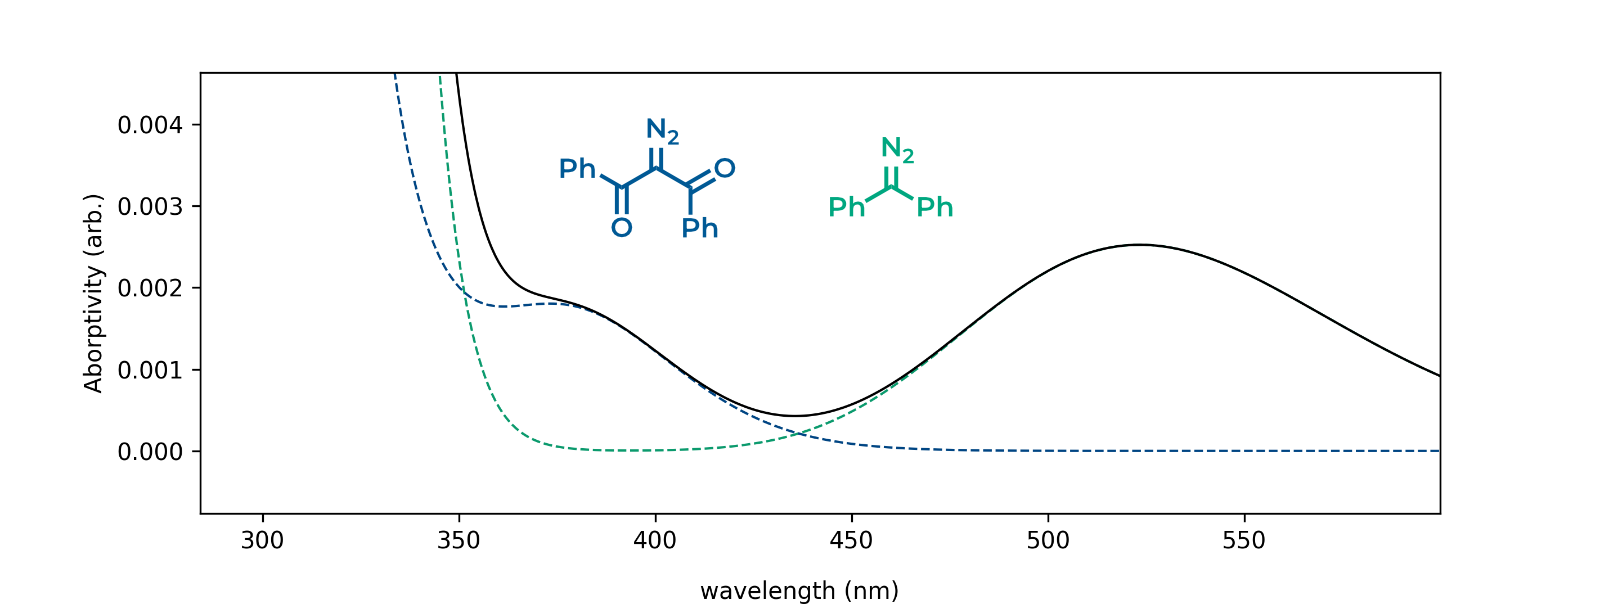
With these settings, navigating to the “plot” tab should reveal an image similar to the one shown below (you will need to zoom in to the relevant transitions). The solid black line represents the sum of the green and blue dotted lines and models what a 1:1 mixture of the two compounds would look like.
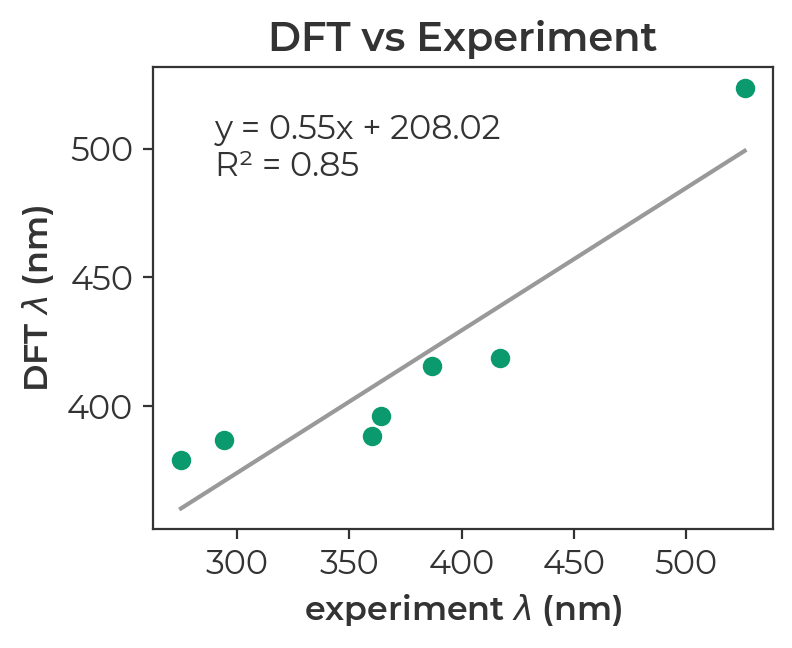
Experiment vs DFT
If we extract the longest wavelength absorption from each output file and plot it against the experimental values, we find that DFT ranks the seven diazo compounds in the correct order, capturing the surprising phenomenon whereby the most conjugated compound has the shortest wavelength.
The Jupyter Notebookused to parse electronic transitions and generate this plot is can be previewed here. To run the notebook on your own machine, download the zipped directory to access the relevant output files and the ipynb file.
Interpreting Absorption
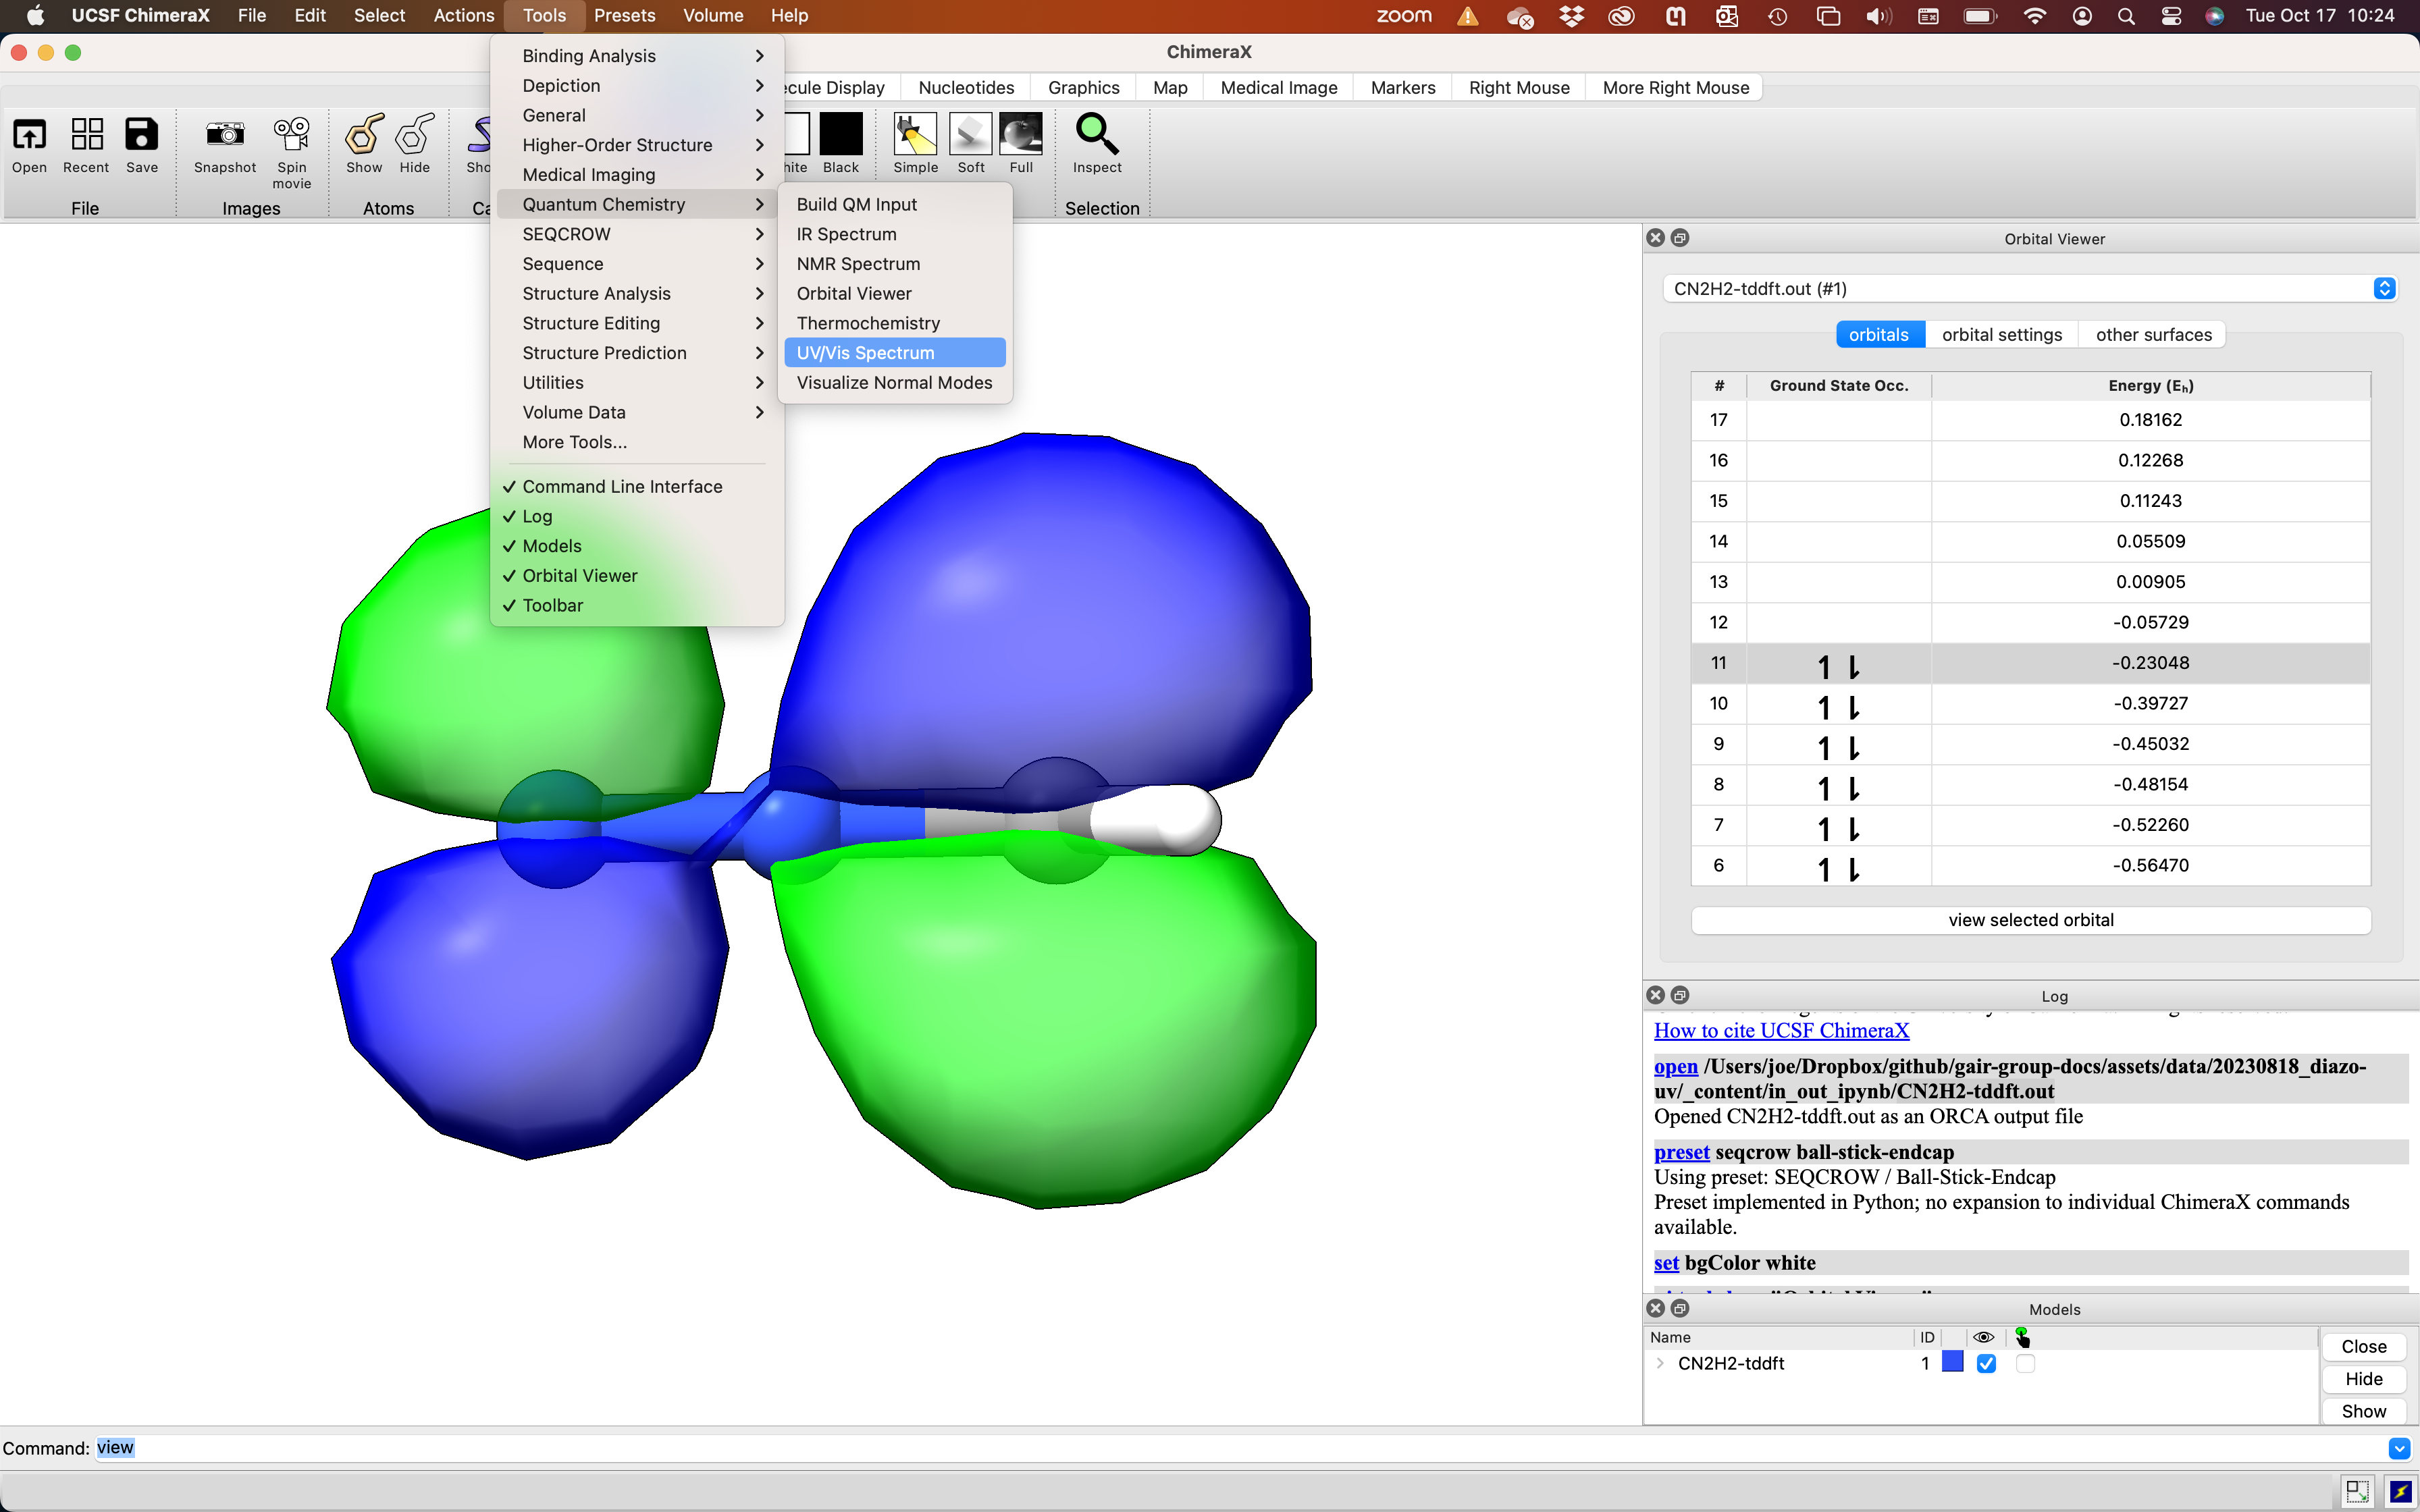
So this series exhibits a surprising trend: the less conjugated molecules absorb light at longer wavelengths. How is this the case? We start by looking at the molecular orbitals involved in the electronic transition. Since we are looking at the lowest energy transition (longest wavelength), we must be looking at the HOMO-LUMO transition. To inspect the HOMO and LUMO, we can open CN2H2-tddft.out with ChimeraX. Then navigate to Tools > Quantum Chemistry > Orbital Viewer. Select the orbital of interest in the pop-up viewer and click ‘view selected orbital’.
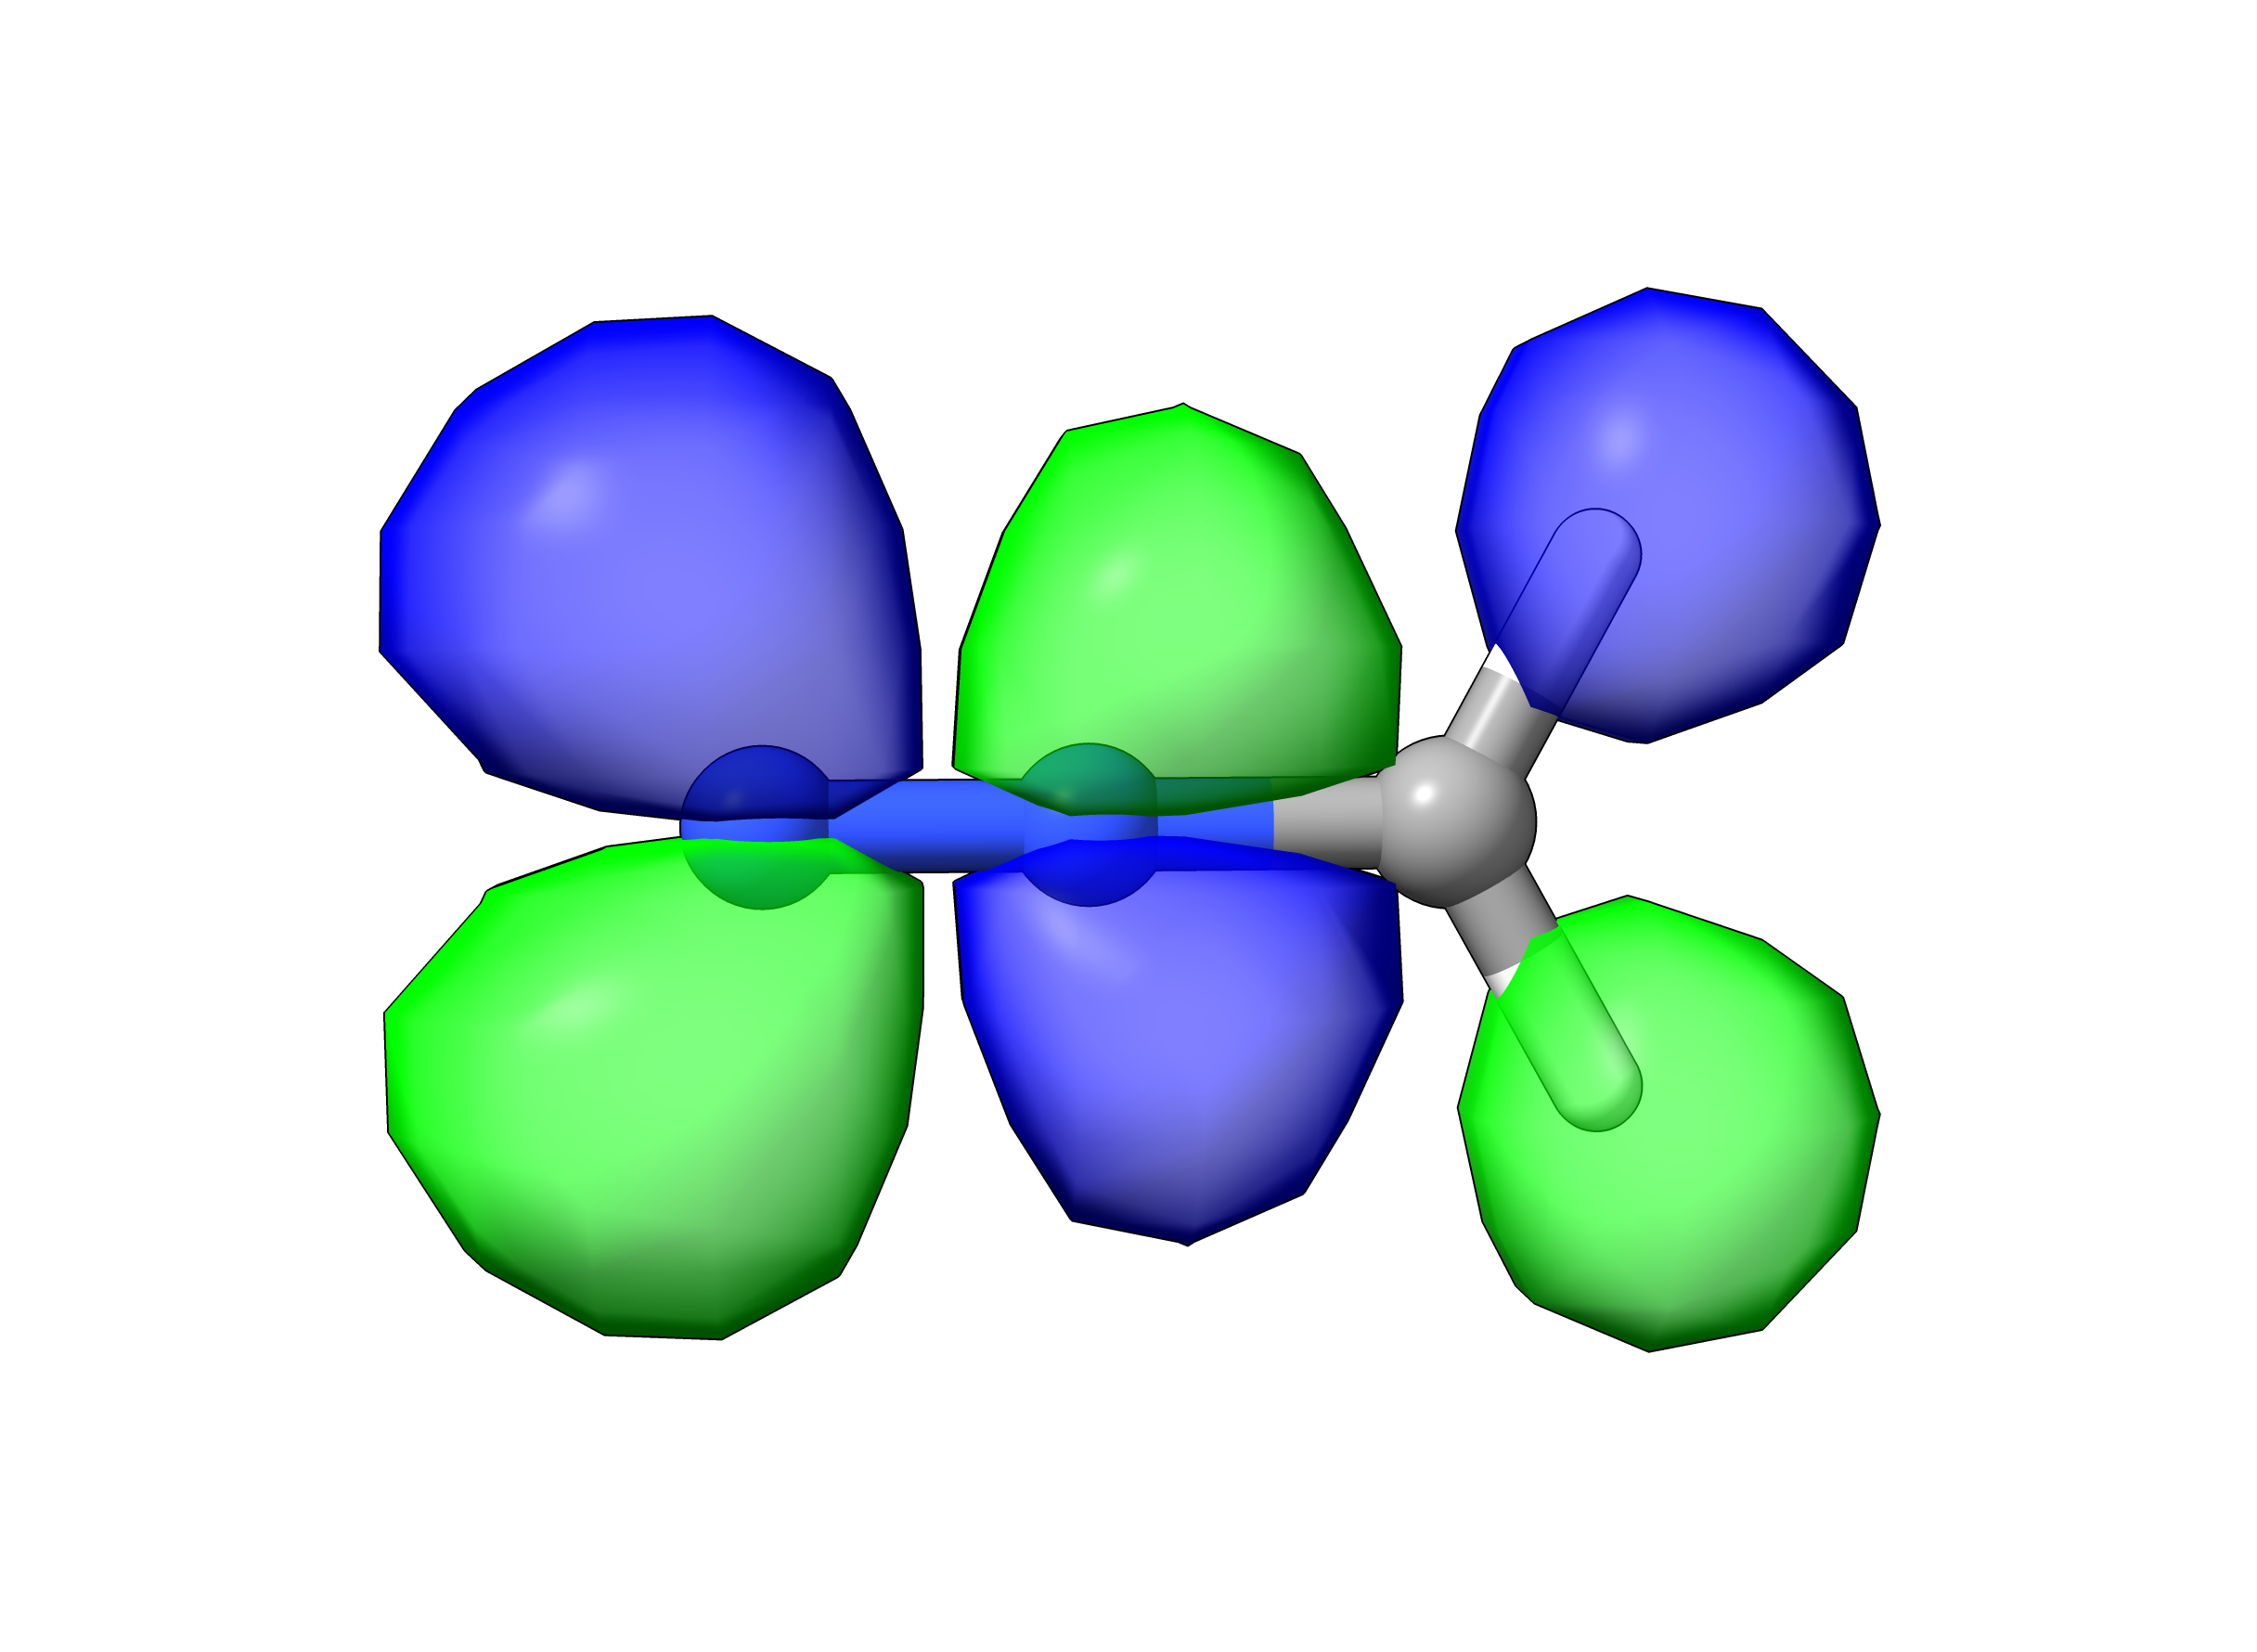
diazomethane HOMO, π(C-N)
As shown in the image above, the HOMO of diazomethane has π(C-N) character and is out of the plane of the molecule. In contrast, the LUMO is in the plane of the molecule and has π*(N-N) character (see image below). The frontier orbitals of diazomethane shown here closely resemble those published for phenyl diazomethane (J. Phys. Chem. A. 2010, 5902).
When the HOMO and LUMO are parallel, increasing conjugation tends to decrease the HOMO-LUMO gap and increase the wavelength of the lowest energy absorption.(ref) The fact that the frontier orbitals are orthogonal (minimal overlap) in the diazo series provides an explanation for why increasing conjugation does not increase the wavelength of the lowest energy absorption.
diazomethane LUMO, π*(N-N)
Reactivity
Now that we know something about the electronic transition that absorbs visible light, can we rationalize the reactivity of the excited state? We noted at the start of the tutorial that photolysis of diazomethane generates methylene (CH2) by extrusion of N2. This reactivity aligns with the orbitals involved in the lowest energy transition. Specifically, we would expect that promoting an electron out of the HOMO, which has C-N bonding character, should decrease the bonding between C-N and favor dissociation of N2 to generate methylene.
Now that you know how to model UV spectra, inspect the molecular orbitals involved in the absorption of light, and use that information to understand reactivity… what yellow molecules do you work with and what will they do when you shine blue light on them?